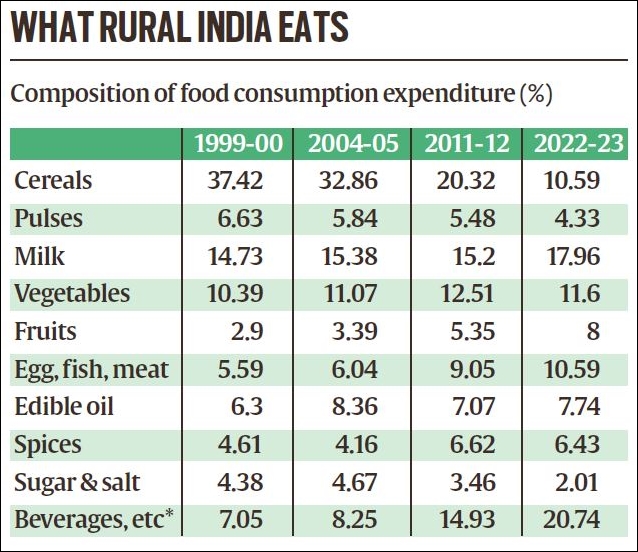
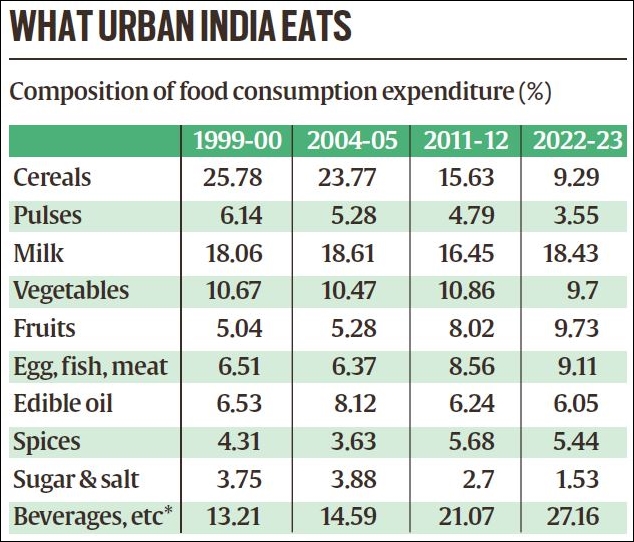
The latest Household Consumption Expenditure Survey (HCES) for 2022-23 does not only point to a continuing decline in the share of food items in the total spending basket of Indians. Equally revealing is a shift in the composition of food expenditure itself — from foodgrains and sugar to animal and horticulture products. In other words, from foods basically delivering calories to those rich in proteins and micronutrients.
The data from the HCES, conducted by the National Sample Survey Office (NSSO), shows the share of food in the average monthly per capita consumption expenditure (MPCE) dipped to 46.4% in 2022-23 for rural India, from 52.9% in 2011-12, 53.1% in 2004-05, and 59.4% in 1999-2000.
A similar, but not as sharp, drop was recorded for urban India too — from 48.1% in 1999-2000, to 40.5% in 2004-05, 42.6% in 2011-12, and 39.2% in 2022-23.
‘Inferior’ to ‘superior’
Households spending relatively less on food with rising incomes over time shouldn’t surprise. What’s interesting, though, is the kind of food items on which they are spending more or less. The accompanying tables indicate five things:
* One, the share of cereals and pulses within overall food consumption expenditure has reduced, both in rural and urban areas.
* Two, the share of spending on milk has increased, so much so as to overtake that on cereals and pulses combined — i.e. foodgrains — in 2022-23.
* Three, the same goes for fruits and vegetables, foods high in micronutrients (vitamins and minerals). The average rural as well as urban Indian has, for the first time in 2022-23, spent more on fruits and vegetables than on foodgrains. The spending on vegetables alone exceeded that on cereals, and likewise for fruits vis-a-vis pulses.
EXPLAINED
THE DEMAND for a “legal guarantee” to MSP is mainly from farmers of 23 crops, including foodgrains and sugarcane. But farm sector’s growth is being led by livestock, fisheries and horticulture crops outside MSP purview. Their growth is largely market demand-driven, which is also borne out by HCES data.
* Four, a growing share of the consumer rupee is also going to eggs, fish and meat. When combined with the rising and falling shares of milk and pulses respectively, it suggests a clear preference among Indian consumers for animal proteins over plant proteins.
* Five, Indians are spending more, as a percentage of their total expenditure, on processed foods, beverages and purchased cooked meals.
Source: Household Consumption Expenditure Survey, National Sample Survey Office. *Includes processed foods and purchased cooked meals.
All the five trends are consistent with the so-called Engel Curve hypothesis. Named after the 19th century German statistician Ernst Engel, it broadly states that as incomes grow, households spend a smaller proportion of that on food. Even within food, they would buy more of “superior” and less of “inferior” items.
In this case, cereals, sugar and pulses are “inferior”, while milk, egg, fish, meat, fruits and vegetables, beverages and processed foods are “superior”.
The HCES data for 2022-23, however, pertains only to the nominal value of monthly per capita consumption expenditure on various food and non-food items. The NSSO factsheet released on Saturday does not contain details of their actual quantities consumed in kilograms or litres. Whether households are spending more on milk, egg and beverages due to higher inflation, or increased quantities consumed of these items, will be known when the detailed survey report comes out.
Source: Household Consumption Expenditure Survey, National Sample Survey Office. *Includes processed foods and purchased cooked meals.
Policy takeaways
The HCES is a valuable data source of what Indian households are consuming and how much. It also provides a basis for estimating the demand for various foods and making projections for the future. That, in turn, enables more informed policymaking. Thus, if consumption of milk, fish, poultry products, and fruits and vegetables is rising much more than cereals and sugar, shouldn’t the focus be on promoting production of the former as opposed to the latter?
It links up with the second point: NITI Aayog member Ramesh Chand has estimated the average annual output growth rate during 2005-06 to 2020-21 for the fruits and vegetables, livestock and fisheries sectors at 4.5%, 5.4% and 7.1% respectively, way above the 1.9% for cereals and other non-horticultural crops.
The growth of the former sectors has notably been market-led and demand-driven. The benefits of minimum support prices (MSP) have, on the other hand, flowed largely to non-horticultural crops — especially rice, wheat, sugarcane, cotton and a few pulses and oilseeds. The demand for making MSP payable by law is also coming mainly from farmers of these crops.
Dairy, poultry and horticulture crops are currently not covered under MSP. Nor are their farmers as vociferous — at least for now — in voicing the demand for “legalising MSP”. The reason for it may have to do with more assured market demand for their produce, as reflected in the HCES data.
Source : The Indian Express Feb 26th 2024

